Most investors like to track project financing information as a criterion to judge their qualification. This article provides detailed statistics on the funding information of 589 tokens issued since July 2020, and calculates the yield (current price/price on the date of publication), max profit (highest price since publication/price on the date of publication) and max loss (lowest price since publication/price on the date of publication) since the release of financing information.
In addition, it presents the reference significance of VC to investors from two perspectives. First, from the perspective of VC, I list 50 well-known VCs' investments and calculate their profits and losses. Secondly, from the perspective of the project, I screen the projects with good performance and explore the VCs behind them (excluding the 50). The reason we don't include data before July 2020 is that funding information at that time is messy and largely undisclosed.
There are significant limitations in this report that readers should note:
It is important to note that the profits and losses of tokens are not calculated from the date of issue, but from the date of funding announcement. Axie Infinity, for example, has risen more than 300 times since its launch, and a number of well-known VCs like a16z and Paradigm participated in its Series B round, but to calculate their actual yield since launch would be to overestimate their actual yield. In fact, the Series B round was announced last October, and Axie's boom happened last summer, so if you only calculate the yield since October, the real number is -50%.
So the true VC yield is -50%, right? Not exactly! We do not know their cost price (especially for private rounds), let alone their exit price (different projects in different rounds of lockup exit cycle are different). Therefore, it is too presumptuous to measure the investment capacity of VCs in this way.
All yields calculated in this article are not representative of VC investment performance, but are only a measure of the value of financing information for investors. Some projects have multiple rounds of funding, with 684 funding data for the 589 projects mentioned above. All funding data are from Dove Metrics and price data are from CoinGecko as of February 14, 2022.
It should be noted that for top VC, the investment return curve will be extended. For example, some projects they invested before July 2020 will also get high yields after that. This paper does not carry out relevant statistics.
Famous VC
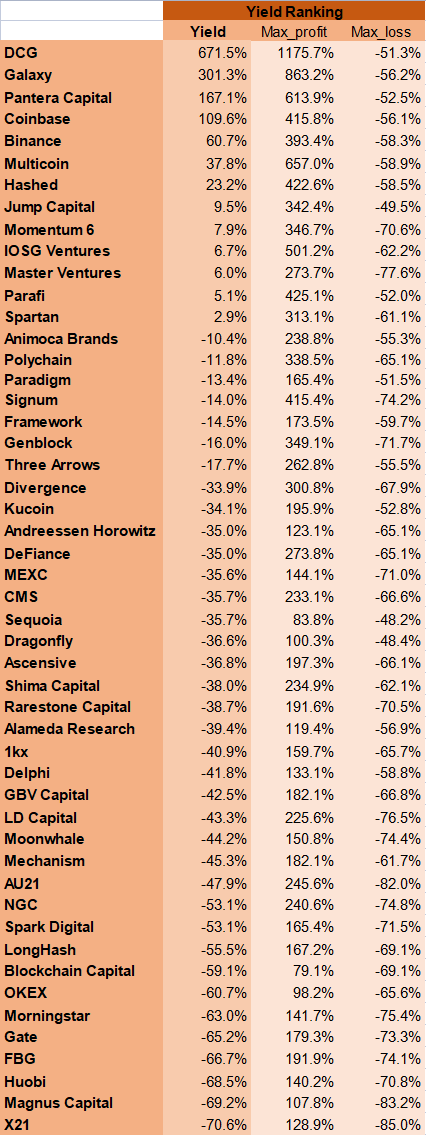
Rank 50 VC according to the yield since the release of investment information:
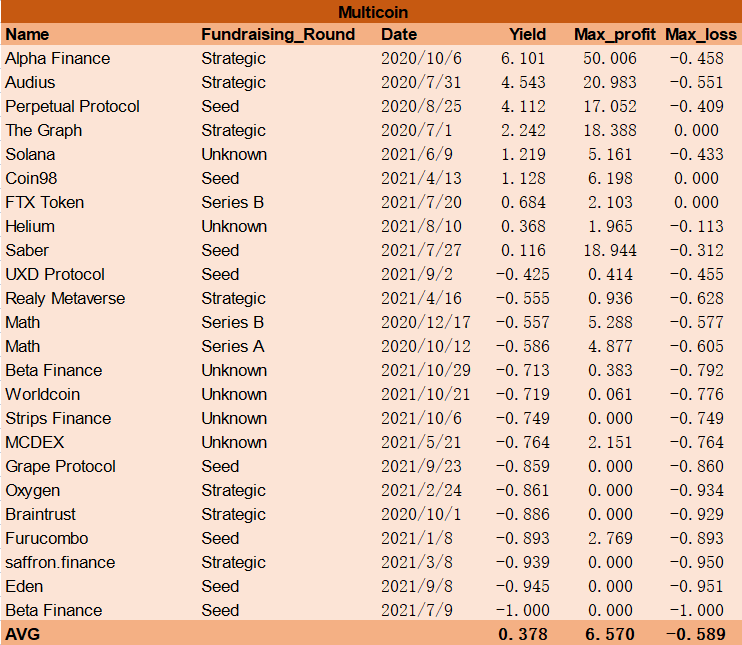
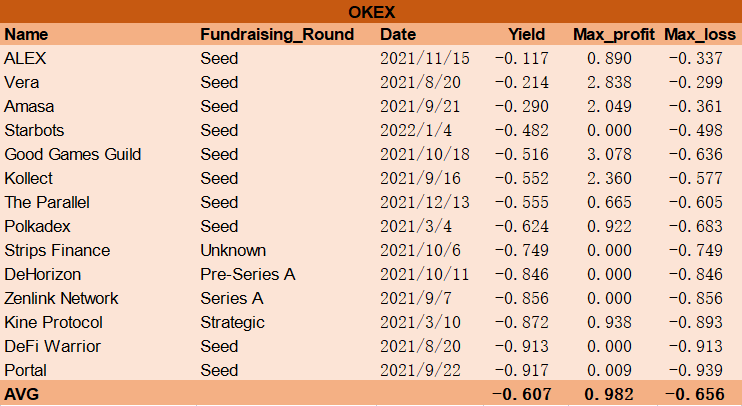
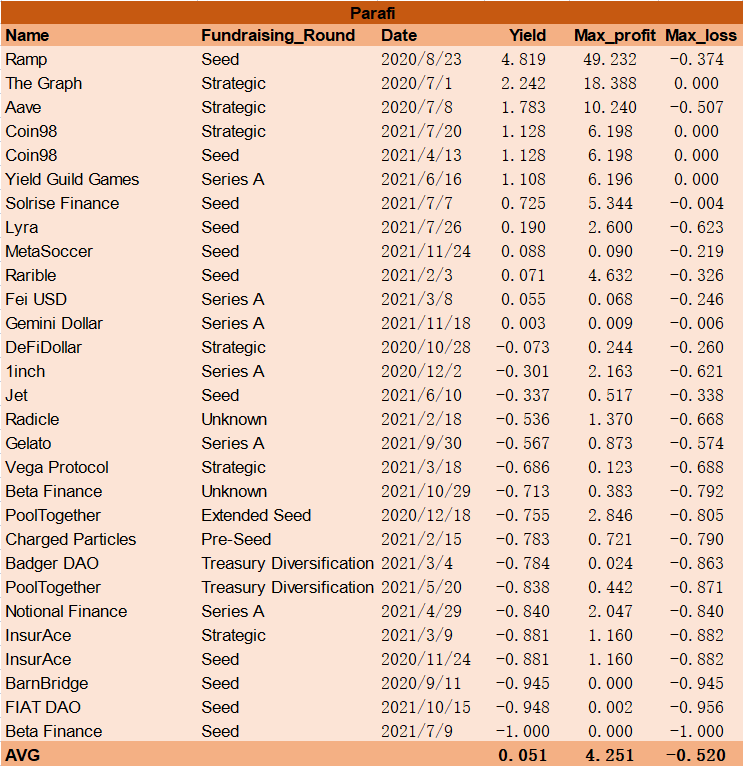
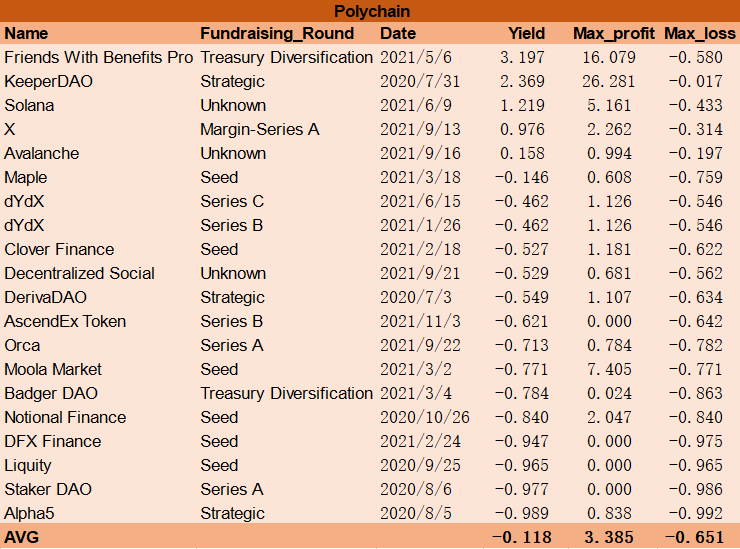
The above three yields are all average yields, which are pulled up by some of the "hundredfold tokens", and most of them are actually losses. However, the primary market is just that: high risk and high return, so the average is more valuable than the median. Among them, 37 VC's yield is negative. Of the remaining 13, 2 had maximum losses greater than 60%. The low maximum return means that even if every item is sold at its peak, the average return is not great; while higher maximum losses mean that a significant loss is incurred during the price downturn.
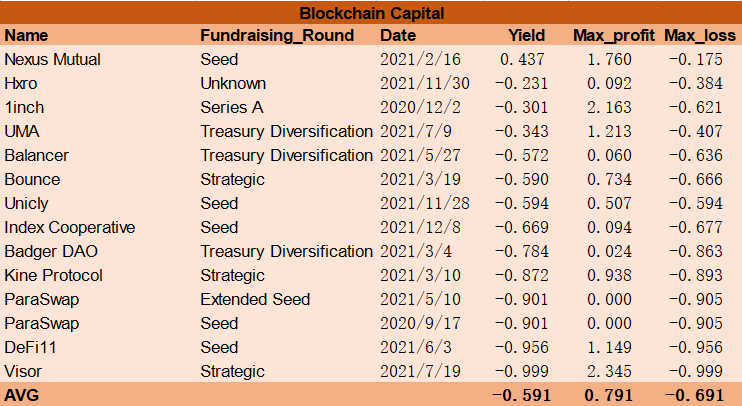
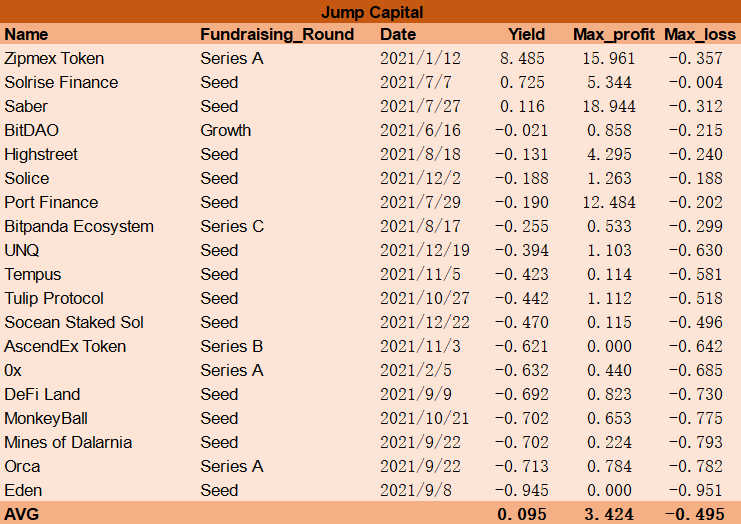
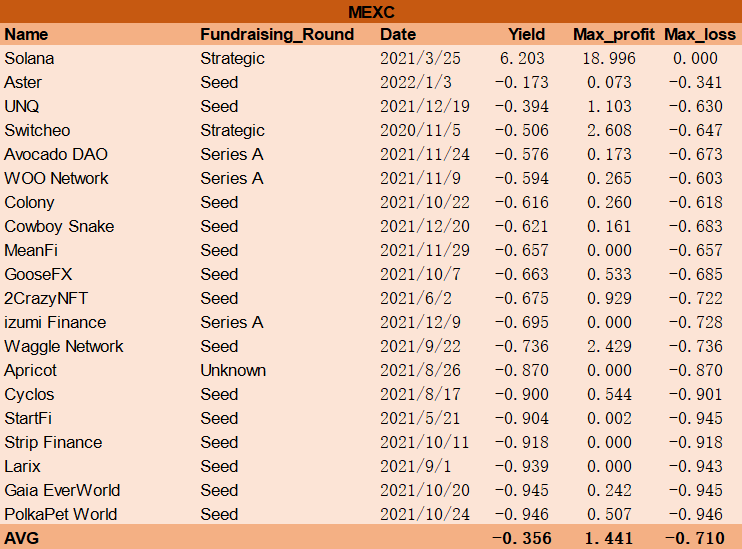
Here are the details of the 50 VCs, in alphabetical order.
1kx
Alameda Research
Andreessen Horowitz(a16z)
Animoca Brands
Ascensive
AU21
Binance
Blockchain Capital
CMS
Coinbase
DeFiance
Delphi
Digital Currency Group
Divergence
Dragonfly
FBG
Framework
Galaxy(Digital&Interactive)
Gate
GBV
Genblock
Hashed
Huobi
IOSG
Jump Capital
Kucoin
LD Capital
LongHash
Magnus Capital
Master Ventures
Mechanism
MEXC
Momentum 6
Moonwhale
Morningstar
Multicoin
NGC
OKEX
Pantera Capital
Paradigm
Parafi
Polychain
Rarestone Capital
Sequoia
Shima Capital
Signum
Spark Digital Capital
Spartan
Three Arrows
X21
Other VC
The filtering steps are as follows:
First, the 684 data were ranked in descending order by return, largest gain, and largest loss since the funding announcement. Then select the VC with 3 or more projects in each revenue ranking in the top 100.
Finally, 25 VCs were obtained:
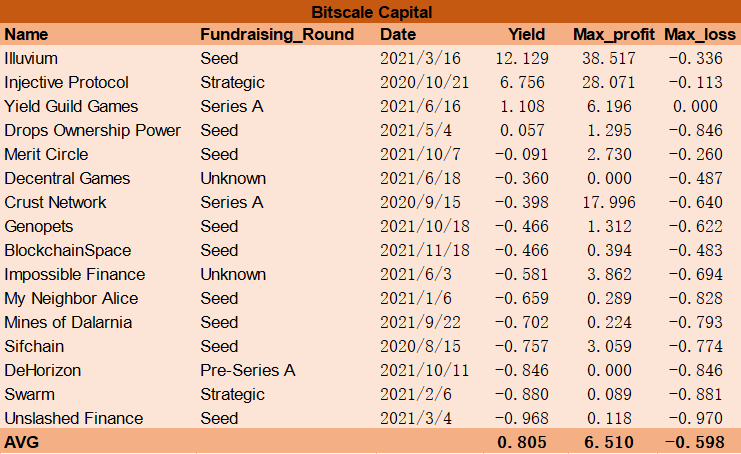
Taking CMS as an example, there are 11 projects in the top 100 in terms of yield, 8 projects in the top 100 in terms of max_profit, and 10 projects in the top 100 in terms of max_loss. CoinFund, SNZ Holding and Bitscale Capital aren't among the 50.
CoinFund
SNZ Holding
Bitscale Capital
Conclusion
To reiterate, all the above yields do not represent VC investment performance, but only measure the reference significance of financing information for investors. Investors can use the financing background as one of the criteria for judging the merits of the project, but have to DYOR, after all, we do not know the exact cost price、exit price and position management of VCs.
Personally, I prefer to refer to the above rate as a "inverted indicator", that is, I may not invest in the projects invested by VCs with high yield, but I will not invest in the projects invested by VCs with low yield in the first time.
Follow us
Twitter: https://twitter.com/WuBlockchain
Telegram: https://t.me/wublockchainenglish















What did you use as a starting price when the announcement date was before the listing date (majority of the cases)?
I see you did not use the listing price ( ico/ido) nor any price within first 24 trading hours. E.g. coinbase, moonbeam was trading lowest around 9 first day and under 6 on the feb 10th while you have yield around -11%.
Great work, takes heart and passion to put this together!